

Tip of the Day 49: Graphing Parts Measurements
If you have proceeded to do an experiment with part sampling (as in Tip # 34) and have entered your measurements with the Measurement Entry tool on the Analyzer then it is wise to check your entries using the Summary Graph. You can add the just entered measurements by right clicking on the Analyzer’s Summary Graph, clicking “Part Measurement” for the type and then selecting any (or all with ctl or shift keys) “locations” shown. These will appear as connected points on the Summary Graph. The lines may make some large diagonal jumps between sample groups but that is ok.
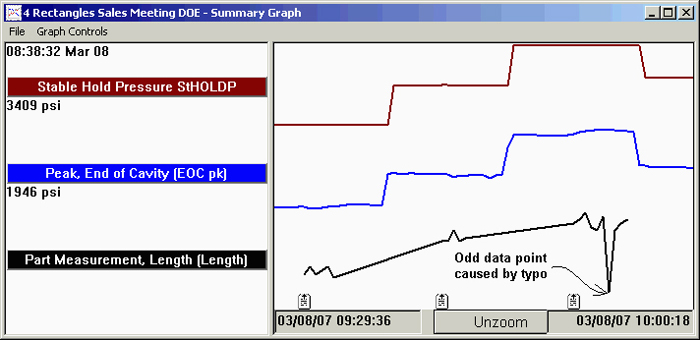
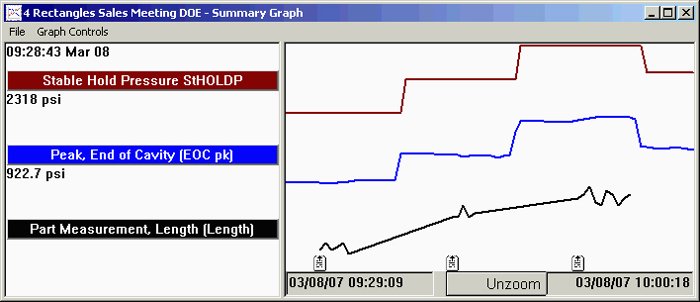
Check the part measurements to see that there are no erratic values. If there are then you may have entered a point incorrectly (decimal point in the wrong place etc.). Simply close the summary graph, open the Measurement Entry tool and correct the values. Then when you open the Summary Graph again the graphs should look sensible.
Graph with Mistake in Measurement Entry
Graph with Mistake Corrected
Furthermore, having run the Autocorrelator you should add to the summary graph those values that best correlate to the part measurements or that you intend to use for setting alarms. This is a sort of sanity check to make sure that the correlation really exists and is not some accident of the experiement.