Tip of the Day 169: Fill Time « #High » is Less than « #Low »?
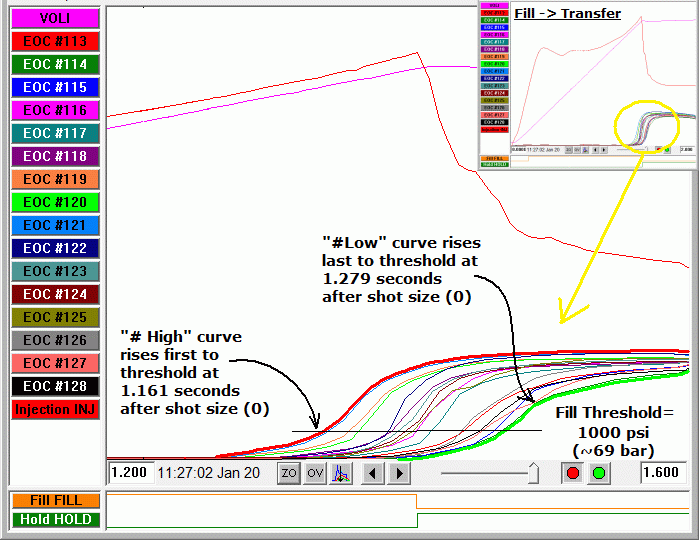
A customer asked the question, « Why does the End of Cavity #High curve always come up with a smaller fill time number than End of Cavity #Low? It seems backwards. » (these are Process Time / Cavity Fill values).
Recall from tip #23 that the eDART™ creates the two curves mentioned above from the highest and lowest value curve at any instant in time†. In the graph below I have highlighted in a thick red line the high curve just outside cavity #121. The thick, bright green line likewise highlights the #Low curve. However the lowest cavity switches in this case.

Logic suggests that the fastest flowing cavity will reach the threshold first and the slowest cavity last. But time is the inverse of speed. So the fastest curve (first to rise) arrives in a shorter time. Hence, numerically, the cavity fill time for the higher curve is a lower time number. The low curve then has the highest time number.
Perhaps this is « Intuitively obvious to the most casual observer« , as my professor used to say. But it made for a quick and easy tip.
Extra Credit Quiz question: Is this a decoupled process? Explain.
† Note that these #High and #Low curves do not necessarily follow just one cavity. At any point the high curve at the beginning can be exceeded by a different cavity. Or the cavity that starts lowest can become higher than another so the new cavity is lowest. The #High and #Low curves form a sort of envelope around the whole set, regardless of which cavity number is high or low at any time.

